Crypto Technical Analysis: BTC, ETH and Altcoins
How to apply technical analysis to crypto: BTC, ETH and altcoin specifics, volatility calibration, the most reliable indicators, and costly common mistakes.
Published on 13 July 2026
Technical analysis works on crypto. But it does not transfer from forex or equities unchanged. Ignore the structural differences of crypto markets — extreme volatility, retail dominance, near-total correlation to Bitcoin, 24/7 trading — and you will make mistakes that are expensive to unlearn.
This guide covers what matters: why technical analysis works particularly well on crypto under the right conditions, how to adjust your approach by asset (BTC, ETH, altcoin), and which indicators produce the most reliable signals on these markets.
Why Technical Analysis Works Well on Crypto — Under Certain Conditions
Crypto markets are dominated by retail participants more than almost any other asset class. In forex, central banks and institutional flows often produce price action that is opaque to outside observers. In crypto, collective psychology shows up on the chart with unusual clarity.
The direct consequence: trend-following signals work exceptionally well during crypto bull phases. When BTC is above its daily 200-period moving average, H4 and H1 moving averages are stacked upward, and RSI stays elevated, that alignment can persist for weeks or even months — considerably longer than the equivalent setup in forex.
During downtrends, the alignment flips with the same clarity. Price drops below the MA200. The moving averages compress and cross downward. RSI stays under 50 persistently. Few markets offer as clean a read on bull/bear regime as crypto does.
The trade-off: that same retail dominance amplifies fakeouts, pump-and-dump schemes, and manipulation — particularly on low-cap altcoins. Technical analysis is less reliable there not because the method fails, but because liquidity and market depth are simply insufficient to support it.
Bitcoin First — Always
Before analysing any other crypto asset, check Bitcoin on the daily chart. This is the single most important rule in crypto technical analysis.
The correlation between BTC and the rest of the crypto market is structurally high. During stress periods it climbs toward 0.9 or higher — nearly every altcoin moves in the same direction as BTC, at the same time, usually with a higher beta.
What this means in practice:
- A bullish signal on ETH or SOL against a strongly bearish BTC backdrop has a much lower probability of success than the individual chart suggests
- A bullish altcoin signal with BTC bullish and above its daily MA200 is structurally far more solid
- During a market panic (BTC down 10%+ in a day), individual altcoin technical setups temporarily lose their relevance
Reading hierarchy:
- BTC W1 — what cycle regime are we in? (bull / bear / accumulation)
- BTC D1 — primary trend and momentum
- Altcoin D1 — the individual signal, read within that context
Never skip to step 3 without confirming steps 1 and 2 first.
Bitcoin-Specific Considerations for Technical Analysis
The Daily MA200 — The Bull/Bear Line
The 200-day moving average is the most closely watched demarcation line in crypto. Price above the daily MA200 signals a favourable environment for buying. Below it, the environment favours selling.
This line has historically acted as major support during BTC bull markets and resistance during bear markets. Because millions of participants watch it, its relevance is partly self-reinforcing.
Simple rule: if BTC is below the daily MA200, cut your long exposure across the entire crypto book significantly.
All-Time High Levels — Absolute Psychological Resistance
Bitcoin's prior all-time highs carry a distinct status. As price approaches a previous ATH, selling pressure from traders "waiting to get back to even" tends to be considerable. These levels often require several attempts before breaking decisively.
Once an ATH is broken and confirmed, the old high frequently becomes solid support — the principle of polarity applies with particular force at these major psychological levels.
Volatility: Recalibrate Your Thresholds
On BTC, a 20–30% correction within an uptrend is normal. On EUR/USD, that would be a major event. Risk management cannot be identical across the two.
- Support/resistance zones: widen them. A BTC "zone" is 1–3% of price, not 40 pips
- RSI: overbought at 70 in forex might last a few hours. On BTC, RSI can sit between 70 and 85 for weeks during a bull market
- Stops: calibrate as a percentage of price (2–5% depending on timeframe), not as a fixed absolute value
Ethereum: Similar to BTC, With Nuances
ETH tracks BTC with a beta typically above 1 — it rallies harder in bull markets and falls harder in bear markets. Technical analysis on ETH follows the same principles as BTC, with a few distinct features.
BTC/ETH correlation is tighter than for most altcoins. ETH can temporarily decouple around ecosystem-specific events (network upgrades, DeFi developments), but these windows are typically short-lived.
The ETH/BTC pair tells you whether ETH is outperforming or underperforming Bitcoin. An uptrend on ETH/BTC combined with a bullish BTC is the most favourable context for long ETH positions.
Key levels: prior ETH all-time highs, round psychological levels (2000, 3000, 4000 USD), and the daily MA50/MA200 are the most widely watched reference points.
Altcoins: Where Technical Analysis Becomes Less Reliable
Technical Reliability by Asset
| Asset | Liquidity | Response to Indicators | Recommendation |
|---|---|---|---|
| Bitcoin (BTC) | ★★★★★ | Excellent | The benchmark — analysable on every timeframe |
| Ethereum (ETH) | ★★★★★ | Very good | High BTC beta, tracks indicators well |
| Solana (SOL) | ★★★★☆ | Good | Usable with a strict trend filter |
| Top 10–30 (BNB, XRP, AVAX…) | ★★★☆☆ | Fair | Always check the BTC context first |
| Altcoins under $50M daily volume | ★★☆☆☆ | Unreliable | Maximum caution — manipulation risk |
Technical reliability is inversely proportional to how far down the market-cap ladder you go. Here is why.
Liquidity problems. An altcoin with $10M in daily volume can be moved by a single large player. Technical patterns form and invalidate within hours for no visible reason. Signals that would work on BTC simply do not transfer.
Spread and slippage. On smaller altcoins, the bid-ask spread alone can run 1–3%. Your technical edge has to overcome that entry/exit cost before it can even become profitable.
A practical filter: limit technical analysis to assets with at least $50M in average daily volume over the trailing 30 days. Below that threshold, signals are too noisy to justify a disciplined technical trade. For the full workflow of applying this filter across a large altcoin list efficiently, see how to scan altcoins efficiently.
Assets that respond best to technical analysis: Bitcoin (BTC) — the absolute benchmark; Ethereum (ETH) — reliable, high BTC beta; Solana (SOL) — good liquidity, solid indicator response; BNB, XRP, AVAX, MATIC — usable with a strict trend filter; anything outside the top 30 by market cap — maximum caution.
The Most Reliable Indicators for Crypto
Moving Averages: D1 MA50 and MA200
These are the most robust indicators on BTC and ETH. The daily MA200 works as a bull/bear filter; the daily MA50 works as dynamic support in a trend. In a bull market, every pullback to the MA50 is a buying opportunity in the direction of the trend.
MA10 above MA20 above MA50 on the daily chart signals a clean uptrend. On H4, that same alignment produces reliable trend-following entries. For filtering this condition across a full crypto watchlist rather than one asset at a time, see how to scan crypto with moving averages.
Indicator Comparison: Forex vs Crypto
| Indicator | Forex | Crypto (BTC/ETH) |
|---|---|---|
| RSI overbought | >70 | >80 in a bull market (can stay >70 for weeks) |
| RSI bull/bear line | 50 | 50 (same logic, more pronounced) |
| MA200 | D1 filter | Critical on both D1 and W1 |
| Stops | In pips | As a percentage (2–5% depending on TF) |
| Support/resistance zones | ±20–40 pips | ±1–3% of price |
RSI: Adapt the Thresholds to Crypto Volatility
RSI 14 still works, but the classic 30/70 levels need recalibrating.
In a BTC/ETH bull market, RSI can sit between 55 and 80 for weeks. The 50 level is the bull/bear line. Pullbacks toward 45–50 are buy zones within the trend. "Overbought" at 70 is not a sell signal.
In a bear market, RSI oscillates between 20 and 55. Bounces toward 50–55 are sell zones. "Oversold" at 30 can persist for a long time.
On altcoins, RSI is noisier and more reactive. Use RSI 21 to smooth signals on volatile altcoins.
Ichimoku: The Most Complete Context Filter
Ichimoku is particularly effective on BTC and ETH daily charts for filtering trending phases from range/consolidation phases.
Price above the daily Kumo signals a structurally bullish context — look for long entries. Price inside or below the Kumo signals transition or bear-market conditions — maximum caution on long positions.
The Ichimoku score (0 to 6 bullish conditions) on BTC D1 is one of the best regime indicators available for crypto. A score of 5–6/6 signals a bull market in full force. A score of 0–2/6 signals a clearly unfavourable environment for buying.
MACD: A Momentum Filter, Not an Entry Signal
Same logic as forex. MACD above zero on D1 confirms the bullish regime. An expanding histogram confirms the trend is accelerating. Used as a D1 context filter, it meaningfully improves trade selection on H4 and H1.
Multi-Timeframe Analysis in Crypto: The Process
The top-down process applies with a few adjustments relative to the forex framework — see best timeframes for crypto scanning for what changes specifically:
W1 BTC → cycle regime (bull / bear / accumulation) D1 BTC → primary trend, position relative to the MA200 D1 altcoin → the individual signal, read within the BTC context H4 altcoin → entry zone, momentum alignment H1/M15 → execution timing
The three-level agreement rule applies strictly: W1 BTC, D1 BTC, and D1 altcoin all need to point the same direction before you look for an H4 entry.
Crypto-Specific Pitfalls
Trading altcoins during a BTC correction. When BTC drops 10%+, nearly every altcoin corrects too, often harder. No altcoin technical signal is reliable during a sharp BTC correction.
Ignoring the crypto events calendar. Token unlocks, major exchange listings, forks, and network upgrades can invalidate any technical setup within minutes. Always check upcoming events on an asset before entering a position.
Trading on low-liquidity exchanges. Prices on thin exchanges can diverge meaningfully from the majors, producing false technical signals. Always reference BTC and ETH prices on Binance or Coinbase.
Over-leveraging. Crypto is already volatile at spot. Adding leverage to a market that can move ±20% in a single day is particularly dangerous. Manage risk through position size, not leverage.
Scanning Crypto Efficiently
With 20–30 crypto assets to monitor across five timeframes, manual scanning runs into the same problems as forex — made worse by markets that never close. If the concept itself is new to you, What Is a Crypto Scanner and How Does It Work? covers what a scanner actually checks and where it stops short of doing the analysis for you.
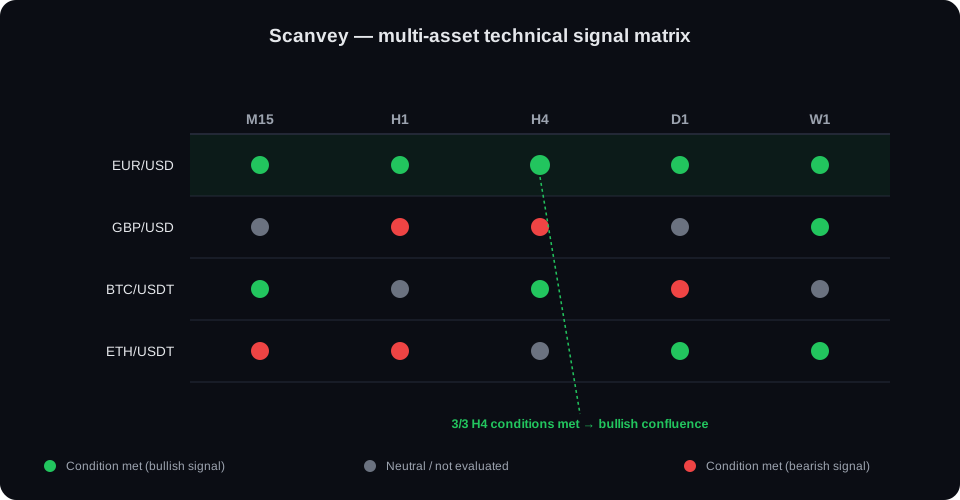
A tool like Scanvey displays the real-time state of your indicators (MA, RSI, MACD, Ichimoku) across every crypto asset and every timeframe simultaneously. You identify bullish multi-timeframe alignment, in a favourable BTC context, in under two minutes — without opening a single chart.
The same matrix covers your forex pairs and your crypto assets side by side: one glance tells you where BTC sits relative to its daily MA200, and which altcoins have their indicators aligned in the same direction.
Automating the detection phase frees up time for the part that cannot be automated: evaluating key levels, managing risk, and making the entry decision. This continuous-monitoring approach is what separates a scanner from a screener — see Crypto Scanner vs Crypto Screener for the distinction.
Conclusion
Technical analysis is a powerful tool on crypto — provided the method is adapted to the market's specifics.
Bitcoin first: always read the BTC context before analysing anything else. The daily BTC MA200 is the single most important bull/bear line in the crypto market. Limit altcoin exposure to assets with sufficient liquidity (top 30 by market cap at minimum). Recalibrate RSI thresholds to crypto volatility — overbought at 70 is not a sell signal in a bull market. The most reliable indicators on crypto are the daily MA200, the daily Ichimoku score, and D1 RSI read against the bull/bear line. Multi-timeframe analysis applies with the same top-down logic, starting from BTC on the weekly chart.
Related articles:
- Bitcoin Technical Analysis: Complete BTC Trading Framework
- RSI Settings for Crypto Trading: What Works on BTC and ETH
- Best Crypto Pairs for Technical Analysis
- Multi-Timeframe Analysis: The Complete Forex & Crypto Guide
- Forex vs Crypto Technical Analysis: Key Differences
- Ichimoku Cloud Forex: How to Trade It Effectively
Scan your crypto assets across every timeframe with Scanvey — MA, RSI, MACD and Ichimoku for BTC, ETH and your altcoins, updated in real time.
Frequently asked questions
Does technical analysis actually work on crypto?
Yes, with nuances. On highly liquid assets (BTC, ETH), technical analysis works well on D1 and H4 — support/resistance levels hold and momentum indicators produce readable signals. On low-cap altcoins, thin liquidity makes manipulation frequent and technical analysis less reliable. Limit crypto technical analysis to assets within the top 50 by daily volume.
Should indicator settings be adjusted for crypto?
Standard parameters (RSI 14, MACD 12/26/9, MA50/200) remain relevant on major crypto assets. The main adjustment concerns volatility: in crypto, RSI can stay above 70 for several weeks during an extended bull market. Treat overbought/oversold thresholds as zones of heightened attention, not automatic reversal signals.
Why does BTC/altcoin correlation make timing so difficult?
During strong BTC trends, altcoin correlation to BTC climbs to 0.8–0.9. A technically perfect altcoin setup can unravel if BTC suddenly drops. The rule: confirm the BTC regime on D1 first, then evaluate altcoin setups. A bullish altcoin signal inside a bearish BTC market is a macro counter-trend position — treat it as higher risk.
Sources: Investopedia — Technical Analysis, CoinMarketCap.
Further reading
These reference resources complement the analysis presented in this article:
Related reading
- Crypto Multi-Timeframe Analysis: BTC, ETH and Altcoins
- Best Timeframes for Crypto Scanning
- Crypto Scanner vs Crypto Screener: What's the Difference?
- How to Scan Altcoins Efficiently
- How to Scan Crypto With Moving Averages
- What Is a Crypto Scanner and How Does It Work?
- Best Crypto Pairs for Technical Analysis
- Bitcoin Moving Averages: The Complete Guide
- Bitcoin Technical Analysis: Complete BTC Trading Framework
- RSI Settings for Crypto Trading: What Works on BTC and ETH
- Forex vs Crypto Technical Analysis: Key Differences
Scan BTC, ETH and your altcoins
MA, RSI, MACD and Ichimoku calculated continuously across 30 crypto assets, 24/7.
Try the crypto scannerThis article is for informational and educational purposes only. It does not constitute investment advice or a trading signal. Trading financial products involves a high risk of capital loss. Full risk disclaimer