Forex Scanning Criteria: What to Look For Before You Trade
The exact trend, momentum and exclusion criteria to define before scanning forex pairs — turn a vague chart review into a repeatable, testable process.
Published on 15 July 2026
Most traders who scan forex pairs do it the same way: open a chart, look at it, decide if something "looks interesting," move to the next pair. There is no written definition of what they are actually looking for. The result is a scan that changes shape every session — generous on a good day, overly strict on a bad one, and impossible to review afterward because nothing was defined in the first place.
Scanning criteria are the fixed, written conditions a pair must meet before it earns a place on your shortlist. Not a feeling. Not "this chart looks like it might break out." A specific, checkable condition: moving average alignment, RSI position, MACD direction, price relative to a key level.
This guide covers the criteria themselves — trend, momentum, and exclusion filters — independent of the step-by-step workflow you run them through. For the process and timing (when to scan, in what order), see how to scan forex pairs efficiently. This article answers the question that comes first: what, exactly, should that process be checking for?
Why undefined criteria produce inconsistent scans
A scan without written criteria has a hidden failure mode: the bar moves. Early in a session, with a clear head, a trader might require full alignment across three timeframes before shortlisting a pair. An hour later, fatigued and having found nothing, the same trader starts accepting partial alignment on pairs that would have been rejected earlier.
This is not a discipline problem. It is a design problem. Human judgment drifts under repetition and fatigue — that is normal, not a personal failing. The fix is not "try harder to stay consistent." The fix is writing the criteria down so consistency does not depend on willpower.
Written criteria also make a scan reviewable. If a trade goes wrong, you can check whether the pair actually met your criteria at entry, or whether you bent the rule under pressure. Without written criteria, every post-mortem turns into a guess.
Trend criteria: read on D1 and H4
Trend criteria answer one question — does this pair currently favour longs, shorts, or neither? They should be checked first, because a pair with no clear trend has nothing worth scanning further.
| Criterion | Bullish signal | Bearish signal | Exclude if |
|---|---|---|---|
| MA alignment | MA10 > MA20 > MA50 | MA10 < MA20 < MA50 | MAs tangled together |
| Position vs MA200 | Price above D1 MA200 | Price below D1 MA200 | Price oscillating around MA200 |
| Ichimoku structure | Price above Kumo, bullish TK cross | Price below Kumo, bearish TK cross | Price inside the Kumo |
| D1 RSI | Above 50 and rising | Below 50 and falling | Oscillating around 50 |
Moving average alignment is the cheapest filter to run and one of the most effective. When the short, medium, and long MAs stack in order, the trend is unambiguous. When they are interleaved, the pair is ranging — and ranging pairs are exactly what a trend-following criteria set should reject.
Price versus the D1 MA200 works as a fast binary filter. Above it, the macro bias favours buyers. Below it, sellers. This single condition does more filtering work per second spent than almost anything else on this list.
Ichimoku structure adds a second, independent confirmation. A pair where price sits cleanly above the cloud, with Tenkan above Kijun, is showing structural agreement across a different calculation method than moving averages — which makes the signal more robust than either indicator alone.
Momentum criteria: read on H4 and H1
Once a pair passes the trend filter, momentum criteria confirm that the move currently has energy behind it, rather than stalling.
RSI in a favourable zone. For a bullish setup, RSI between 50 and 65 indicates trend-supportive momentum without being extended. Above 70 on a fresh entry attempt is a caution flag, not an automatic reject — but it changes how the setup should be sized and where the stop belongs.
MACD direction and expansion. A MACD histogram expanding in the direction of the D1 trend on H4 is a clean momentum confirmation. A histogram that is flattening or contracting, even while price direction technically agrees with the D1 bias, suggests the move is losing steam before it has even been entered. For the workflow of checking this crossover condition across an entire watchlist rather than one pair at a time, see how to detect MACD crossovers across multiple pairs.
Recent MA crossover. A short-term MA crossover (MA10 over MA20) within the last few H1 candles flags a pair where momentum has just turned in the expected direction — useful as a trigger criterion layered on top of the trend and momentum filters above.
Exclusion criteria: what to filter out immediately
A criteria set is only as good as what it rejects. These conditions should remove a pair from consideration regardless of how attractive anything else on the chart looks:
- Spread abnormally wide ahead of a scheduled high-impact release
- D1 and H4 both range-bound simultaneously — no trend on either timeframe means no trend-following setup worth taking
- Higher and lower timeframes in direct contradiction (D1 bullish, H4 firmly bearish, with no sign of resolution)
- Price sitting immediately against a major round number or historical D1/W1 level, in either direction
Exclusion criteria matter as much as inclusion criteria. Most scanning failures are not "missed a good setup" — they are "took a setup that should have been excluded in the first place."
Which pairs deserve criteria checks first
Not every pair is worth running the full criteria set on every session. A practical priority order:
Tier 1 — EUR crosses: EUR/USD, EUR/GBP, EUR/JPY, EUR/CHF, EUR/CAD, EUR/AUD, EUR/NZD. Tightest spreads, most reliable technical behaviour — check these first, every session.
Tier 2 — USD and GBP majors: GBP/USD, GBP/JPY, USD/JPY, USD/CHF, USD/CAD, AUD/USD, NZD/USD. Strong liquidity, solid signal reliability — check after Tier 1.
Tier 3 — JPY and remaining crosses: AUD/JPY, NZD/JPY, CHF/JPY, CAD/JPY, AUD/NZD, AUD/CAD, AUD/CHF, CAD/CHF, NZD/CAD, NZD/CHF. Can produce strong setups, particularly on JPY pairs during strong trends — check last, or only if Tiers 1-2 come up empty.
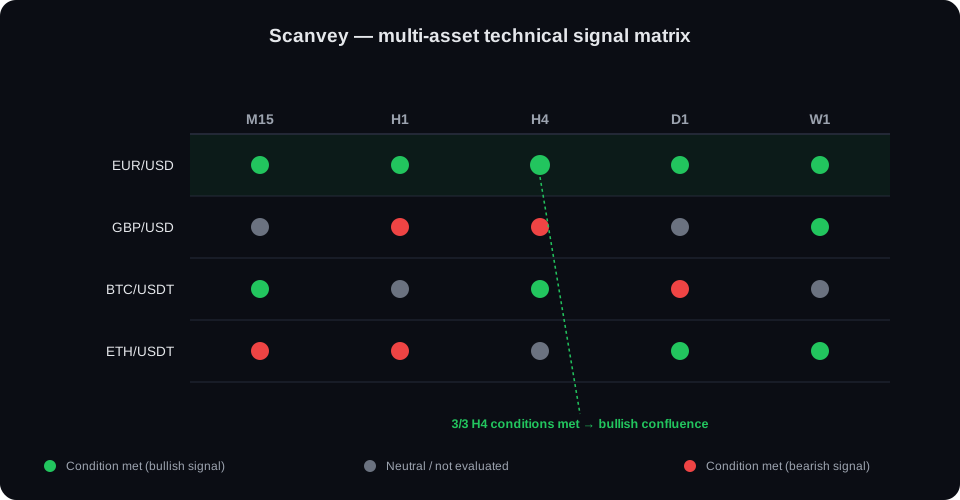
Once criteria are defined, checking them across 20-30 pairs and multiple timeframes by hand is the exact bottleneck Scanvey is built to remove: the matrix evaluates the same MA, RSI, MACD, and Ichimoku conditions across every pair and timeframe simultaneously, so a manual half-hour of chart-flipping becomes a glance.
Turning criteria into a process
Defined criteria are the input; a repeatable process is what runs them consistently. The two are separate problems on purpose — bundling them together is why so many traders end up with rules that quietly change from session to session.
The short version: apply the trend criteria first to cut the pair list down, apply momentum criteria to the survivors, then move to lower timeframes only on pairs that passed both. For the full step-by-step sequencing — including how often to run it depending on your trading style — see how to scan forex pairs efficiently.
Common mistakes when defining scanning criteria
Criteria that are too vague to fail. "Looks like a strong trend" is not a criterion — it cannot be checked objectively, which means it cannot be enforced under pressure. Every criterion should be answerable with a specific value: yes/no, above/below, a number.
Too many conditions required simultaneously. Requiring six indicators to align perfectly before a pair qualifies will produce almost no candidates, most sessions — and the rare session where everything aligns is not necessarily a better trade than one with three strong, independent confirmations.
No exclusion criteria at all. A criteria set built only around what to include, with nothing defining what to reject outright, lets marginal setups slip through on quiet days when the trader is eager to find something to trade.
Criteria copied from someone else without adaptation. A criteria set built for D1 swing trading, applied unchanged to M15 scalping, will misfire constantly — the acceptable RSI range, the MA periods that matter, and the definition of "trending" all shift with timeframe and style.
A scanning criteria checklist template
A starting template to adapt to your own approach:
Trend filter (D1)
- MA10 / MA20 / MA50 aligned in trend direction?
- Price on the correct side of D1 MA200?
- D1 RSI on the correct side of 50?
Momentum filter (H4)
- H4 trend agrees with D1?
- MACD histogram expanding in the trend direction?
- RSI in a favourable, non-extreme zone?
Exclusion check
- Any high-impact release within the next 30 minutes?
- Is either D1 or H4 range-bound?
- Is price sitting directly on a major level with no room to react?
Only if all three sections pass: move to H1/M15 for entry timing.
Conclusion
Criteria come before process. A trader with a well-defined, written set of trend, momentum, and exclusion conditions will scan more consistently with a plain watchlist and a spreadsheet than a trader with the best scanning software and no defined criteria at all. The tooling compresses the time the checks take — it does not decide what to check for.
Write the criteria down. Test them against your own trading history. Adjust the thresholds, not the discipline of having thresholds at all.
Related articles:
- How to Scan Forex Pairs Efficiently — the step-by-step process these criteria feed into
- Multi-Timeframe Analysis: The Complete Guide — the method behind the trend criteria above
- Building a Forex and Crypto Watchlist — deciding which pairs to scan in the first place
- The Ultimate Forex Trading Checklist — what comes after a pair passes your criteria
- TradingView Alternatives for Forex Scanning — tools that can run these criteria automatically
- Manual vs Automated Forex Scanning — the case for and against doing this by hand
See where your criteria are met across every pair, in real time. Try Scanvey for free — the multi-timeframe matrix checks your conditions so you do not have to.
Frequently asked questions
What is the difference between scanning criteria and a scanning process?
Criteria are the fixed conditions a pair must meet — moving average alignment, RSI position, MACD direction. A process is the sequence and timing in which those criteria get checked — which timeframe first, how often, at what time of day. The criteria stay largely stable across sessions; the process adapts them into a daily or weekly routine. Confusing the two is why some scanning routines feel inconsistent even when the trader believes they are "using the same criteria" every day.
How many criteria should a forex scan require?
Three to five independent conditions is a practical range. Fewer than that and the filter barely narrows anything down. More than five, especially if they must all align simultaneously, produces so few qualifying pairs that the scan becomes impractical on most sessions. Independent conditions — trend, momentum, and one structural filter like Ichimoku or a key level — tend to outperform a longer list of correlated indicators that all measure roughly the same thing.
Should scanning criteria change by timeframe?
Yes. Criteria calibrated for D1 swing setups — wider RSI bands, larger MA periods — will reject too aggressively or too loosely if applied unchanged to M15 scalping. The underlying logic (trend, momentum, exclusion) stays the same across timeframes; the specific thresholds and periods should be recalibrated for the timeframe being scanned.
Can scanning criteria be automated?
Yes — this is precisely what a multi-pair, multi-timeframe scanner does. Once criteria are defined in checkable terms (moving average order, RSI range, MACD sign, price versus a level), they translate directly into conditions a tool can evaluate continuously across an entire watchlist, removing the manual chart-by-chart checking this guide describes.
Further reading
These reference resources complement the analysis presented in this article:
Related reading
- Forex Scanner for Swing Trading
- Forex Scanner vs Forex Screener: What's the Difference?
- How to Filter Forex Pairs Using RSI
- How to Rank Forex Pairs Before Opening Your Charts
- How to Detect MACD Crossovers Across Multiple Forex Pairs
- How to Scan Forex Before Major Sessions
- What Is a Forex Scanner and How Does It Work?
- Best Forex Pairs for Technical Analysis
- How to Build a Focused Forex Watchlist
- How to Scan Forex Pairs Efficiently
- Manual vs Automated Forex Scanning: Which Is Better?
Scan your forex pairs in real time
See at a glance where your technical conditions align, across 30 pairs and 5 timeframes.
Try the forex scannerThis article is for informational and educational purposes only. It does not constitute investment advice or a trading signal. Trading financial products involves a high risk of capital loss. Full risk disclaimer