How to Spot Potential Market Reversals: Momentum, Trend Exhaustion and Divergence
A market reversal never shows up in a single indicator. Momentum, trend exhaustion and RSI divergence: the method for spotting setups worth a closer look.
Published on 17 July 2026
Every trend, no matter how strong, eventually stops. The real question was never if — it's when, and more importantly, how to see it coming without relying on a gut feeling.
Most traders catch a reversal after the fact: a candle breaks a support level, a close surprises everyone, and in hindsight the signs were there all along. The issue is rarely a lack of attention. It's that they're looking for one signal — a crossover, an RSI reading — when a reversal actually builds up across several observations that, taken individually, mean almost nothing.
This guide covers three families of signals that, together, help you spot a potential reversal setup: a shift in momentum, trend exhaustion, and a divergence between price and an oscillator. None of the three predicts the future. Each one reduces uncertainty.
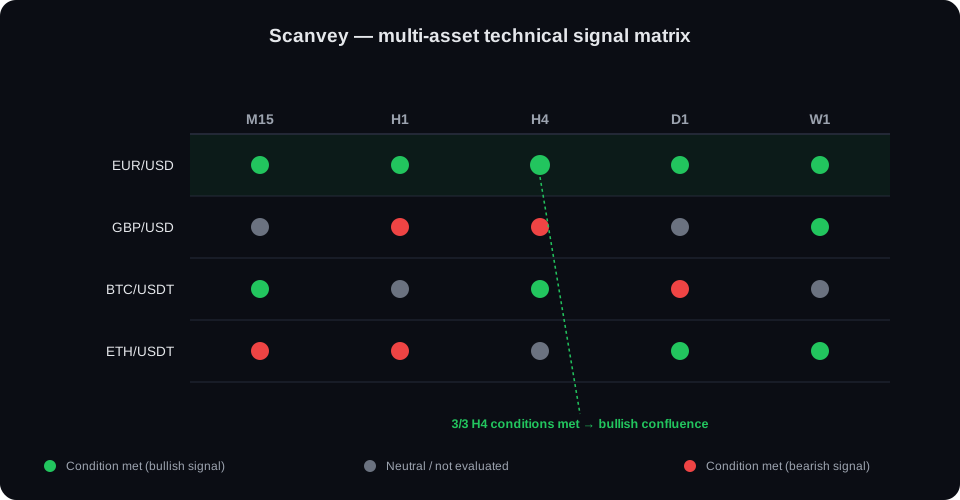
A reversal is never a single signal
This is the most common mistake: seeing an RSI above 70, or momentum slowing down, and concluding a reversal is imminent. A high RSI means an asset is in overbought territory — not that it's about to drop. A trend that's losing steam can easily pick back up after a brief pause.
A market reversal, as this guide defines it, is a durable change in direction — as opposed to a pullback, a temporary breather inside a trend that stays structurally intact (more on that distinction below). Telling the two apart with any reliability means cross-checking several kinds of observations:
- Is momentum slowing down or changing direction?
- Is the trend showing structural signs of exhaustion, or just pausing?
- Is there a divergence between price and an oscillator like the RSI?
None of these three questions, taken alone, is enough to conclude anything. It's their combination that turns three weak observations into a setup worth a closer look — never a certainty, but a signal worth digging into.
Momentum can shift direction
Momentum measures the speed and strength of a price move, not just its direction. An uptrend that keeps climbing but at a slower and slower pace loses momentum before it loses direction — often the first observable signal, well before any support level actually breaks.
In practice, a momentum shift can show up as a slowdown in the speed of price moves, as a MACD histogram contracting while price keeps pushing higher, or as an RSI struggling to reach new highs despite a fresh push in price.
Momentum isn't static: it slows, stabilizes, and then either resumes in the same direction or reverses. The challenge isn't spotting an isolated slowdown — that's common and often goes nowhere — it's putting it in context alongside the other signals covered on this page.
Momentum Reversal Signals: How to Detect a Potential Shift in Market Momentum goes deeper on this: what separates a simple slowdown from a genuine momentum shift, and the most common mistakes in reading it.
A trend can show signs of exhaustion
Every strong trend shares one trait: each new push is confirmed by a consistent set of signals — volume, momentum, price structure. A trend running out of steam gradually loses that consistency before it stops outright.
The most observable signs of exhaustion: shorter and shorter impulses separated by deeper and deeper retracements, a loss of the usual confirmation from trend indicators, or price struggling to set meaningful new extremes even though the broader structure is still technically bullish (or bearish).
One key point that gets overlooked often: trend exhaustion is not a guaranteed reversal. A trend can lose steam, pause for an extended stretch, and then resume in the same direction once the digestion phase is over. Exhaustion creates the conditions favorable to a reversal — it doesn't mechanically trigger one.
Trend Exhaustion: How to Identify When a Market Trend Is Losing Strength covers the observable signs in depth, along with the difference between a trend catching its breath and a trend actually stopping — a distinction that requires a multi-timeframe view to get right.
A divergence can signal weakening strength
Divergence is one of the most misunderstood concepts in technical analysis, often because it gets presented as a direct buy or sell signal — which it isn't.
A divergence appears when price and an oscillator (typically the RSI) tell two different stories: price sets a new high, but the oscillator sets a weaker high than the previous one. That mismatch signals the force behind the price move is fading, even though price itself is, for now, still climbing.
The general theory of RSI divergence (regular and hidden, bullish and bearish) is already covered in depth in the complete RSI guide — this guide doesn't repeat it. What's usually missing is a way to spot these divergences across several pairs and crypto assets at once, without comparing every chart side by side by hand.
RSI Divergence Scanner: Spot Divergences Across Your Entire Watchlist covers exactly that angle — a scanner, not a rehash of theory already taught elsewhere.
Reversal vs pullback: the distinction that changes everything
This is probably the single most expensive question to get wrong. A pullback is a temporary retracement inside a trend that, underneath it all, is still intact. A reversal is a structural change in direction. In the first few candles, the two can look identical.
Mixing them up in either direction is costly: exiting a position on what's just a pullback means abandoning a trend that's still valid; treating a genuine reversal as a pullback means staying exposed to a confirmed change in direction.
Reversal vs Pullback: The Distinction That Changes Everything lays out a structured decision framework for telling the two apart, leaning in particular on multi-timeframe analysis — a pullback on a lower timeframe is often a non-event on a higher one, while a genuine reversal tends to confirm across several timeframes at once (see the complete multi-timeframe analysis guide for the method).
Combining these observations
Taken separately, a momentum slowdown, a sign of trend exhaustion, and an RSI divergence are three weak signals, each with its own share of false positives. It's their combination, on the same asset within a tight time window, that turns three individually unreliable observations into a setup that deserves a real look.
This principle isn't unique to reversals — it's the general principle of confluence in technical analysis, already covered in depth in the complete guide to combining technical indicators. What's specific to reversals is which signals to combine (momentum, exhaustion, divergence) and why they reinforce each other in this particular context — a special case of general technical confluence, not a separate concept.
In practice, a setup worth your attention looks like this: momentum slowing down and signs of trend exhaustion and an RSI divergence, observed on the same asset, within a tight time window. Any single one of these three, on its own, usually doesn't justify action. All three together justify, at minimum, a closer look — never an automatic decision.
That's exactly what Reversal Radar is built to surface: Scanvey continuously analyzes the relationships between momentum, trend structure and RSI divergences across your entire watchlist, and visually flags assets where several of these observations line up — the final call is always yours.
Frequently asked questions
Can a market reversal be predicted with certainty?
No. No indicator or combination of indicators predicts a reversal with certainty. The signals covered in this guide (momentum, trend exhaustion, divergence) reduce uncertainty and help you spot setups worth analyzing further — they don't guarantee any outcome.
What's the difference between a reversal and a correction?
A correction (or pullback) is a temporary retracement inside a trend that remains broadly intact. A reversal is a structural, durable change in direction. See Reversal vs Pullback for a detailed decision framework.
Do I need to combine several signals to analyze a potential reversal?
That's this guide's recommendation: a single signal (momentum, trend exhaustion, or divergence) taken in isolation produces a lot of false positives. Combining them on the same asset, within a tight time window, produces a more meaningful setup.
Does Scanvey give a buy or sell signal on reversals?
No. Scanvey displays the state of technical conditions related to momentum, trend exhaustion and divergences across your watchlist. It's an analysis and setup-spotting tool — the final analysis and the decision to enter a position remain entirely yours.
Key takeaways
- A market reversal is never confirmed by a single indicator — momentum, trend exhaustion and divergence need to be cross-checked
- A momentum slowdown can precede a change in direction, but can just as easily precede a pause
- Trend exhaustion creates conditions favorable to a reversal — it doesn't mechanically trigger one
- A divergence between price and RSI signals weakening underlying strength, without being a buy or sell signal
- Combining these three families of signals, on the same asset within a tight time window, is what turns weak observations into a setup worth analyzing
- Telling a reversal apart from a pullback is the costliest distinction to get wrong — multi-timeframe analysis helps settle it
Related articles:
- Momentum Reversal Signals — how to detect a potential shift in market momentum
- Trend Exhaustion — the observable signs of a trend losing strength
- RSI Divergence Scanner — spot divergences across your entire watchlist
- Reversal vs Pullback — the distinction that changes everything
- Complete RSI guide — full theory of regular and hidden divergences
- Technical Indicators Combination — the general principle of indicator confluence
- Multi-Timeframe Analysis, the complete guide — putting a reversal signal in context across timeframes
Want to spot these setups without scanning every asset by hand? Discover Reversal Radar — Scanvey continuously analyzes momentum, trend exhaustion and divergences across your entire forex and crypto watchlist.
Further reading
These reference resources complement the analysis in this article:
Related reading
Spot reversal setups with Reversal Radar
Momentum, trend exhaustion and divergence, tracked continuously across your entire watchlist.
Discover Reversal RadarThis article is for informational and educational purposes only. It does not constitute investment advice or a trading signal. Trading financial products involves a high risk of capital loss. Full risk disclaimer